Recently I was tasked with building a Return on Investment Calculator in Power BI, for our sales team to demonstrate what sort of return a client may receive for their advertising spend.
So I needed to provide number inputs to deliver this and quickly found there are no out of the box or custom visuals to deliver this.
W.T.F?! No, wait, I can use What-if parameters!

In this case we used the following inputs…
- Date Period – a date range. by default we use the last 12 months, as it simplifies the process to determine and enter the other values.
- Advertising Investment $ – what they spend with us per year. NB: We could get this from our database. we will do this in phase 2 of the tool.
- Average Customer Spend $ – what an average customer spends per year. This should be provided by the client
We then use traffic data (profile clicks) as a base to determine lead to customer conversion.
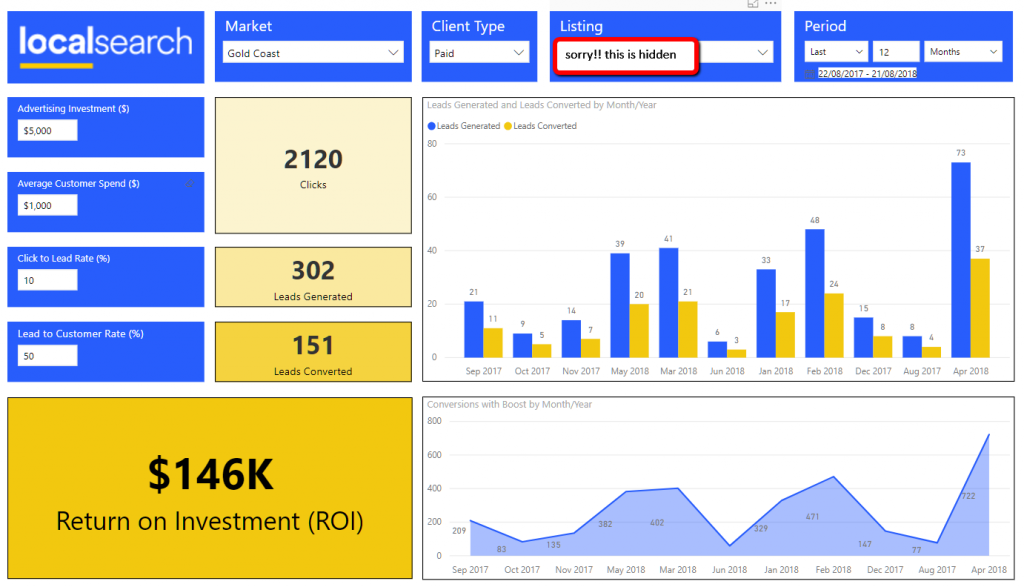
There are then inputs for conversion from leads to customers, which the customer should also provide based on their experience.
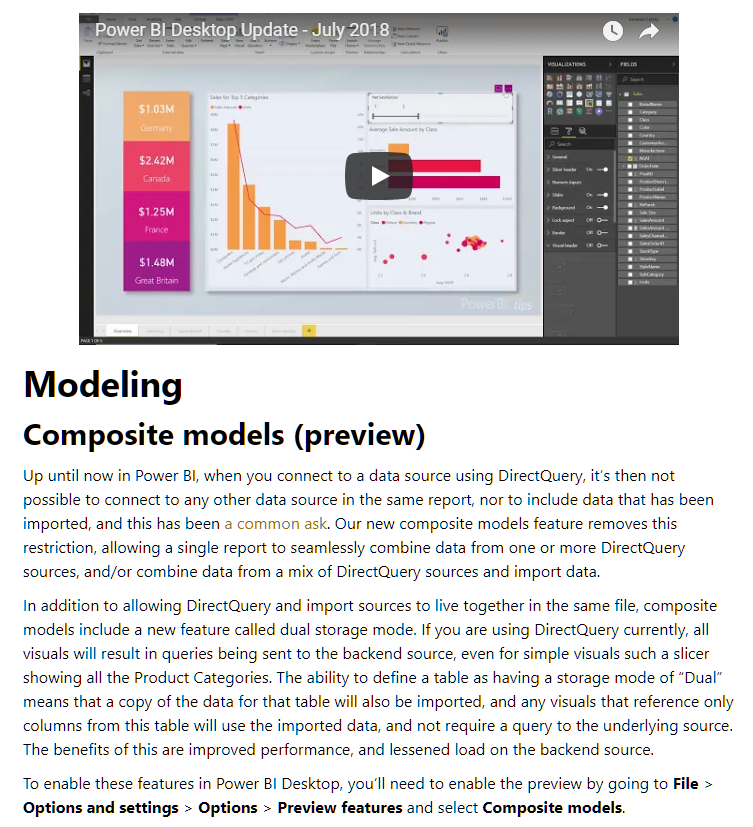
There are some restrictions on how you can use the “what-if” feature and I will run through adding a what-if parameter to highlight this. This feature was made active in the August 2018 release and is briefly described here
To create a new What If parameter, select “new Parameter – What If” from the modelling menu in Power BI.
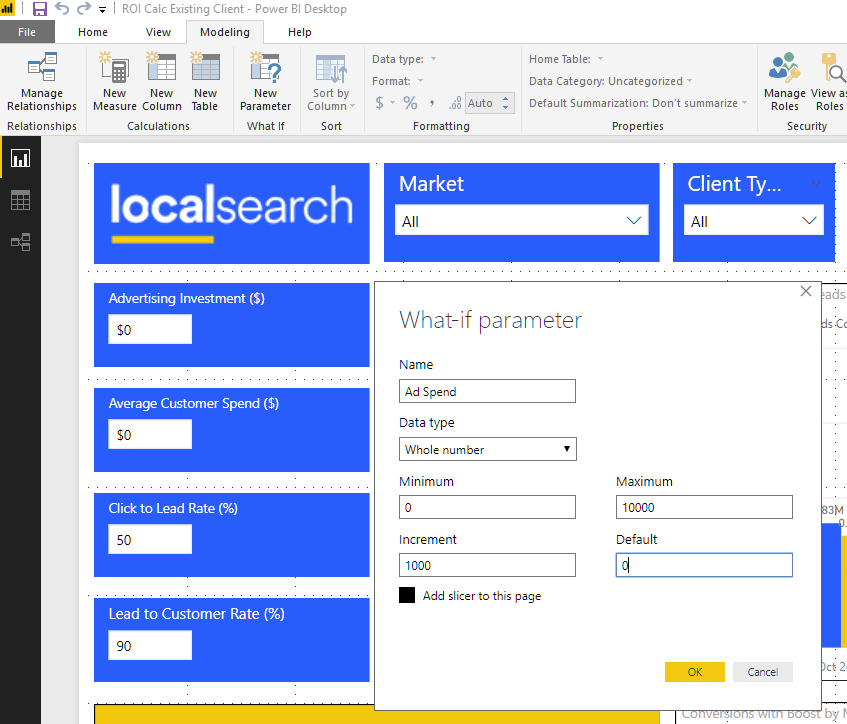
You need to give your parameter the following:
- Name: This is what it is called in the Model. you can change the label if you use as a filter
- Data Type: whole, decimal or fixed decimal. I used decimals for the percentages in click to client conversion rates.
- Minimum: starting value for range
- Maximum: ending value for range
- Increment: value the range increment by
- Default: what value should be used on load
This then creates a table in your model with the incremental values and the default value as a measure. this is what mine look like.
- Advertising Investment = GENERATESERIES(0, 10000, 100)
- Campaign Investment Value = SELECTEDVALUE(‘Advertising Investment'[Campaign Investment], 0)
As you can see from the Advertising Investment we now have a series that goes from 100 to 10000. This is where I highlight the limitation of using what if – you can only use a maximum of 1000 values.
This presents an issue for us particularly in entering average customer spend, as due to the varient of our clients it could range from $10 (cafe) to $50,000 (pool builder). This has been noted as a short coming and you can vote for Microsoft to fix it by going here
Ignoring this, the what if parameter has provided a very useful way of providing numeric input in your Power BI reports. Another big thumbs up to the Power BI team.


