Using the “Whatif” feature in Power BI to build a Return on Investment (ROI) Calculator

Recently I was tasked with building a Return on Investment Calculator in Power BI, for our sales team to demonstrate what sort of return a client may receive for their advertising spend.

So I needed to provide number inputs to deliver this and quickly found there are no out of the box or custom visuals to deliver this.
W.T.F?!  No, wait, I can use What-if parameters!

In this case we used the following inputs…

  • Date Period – a date range. by default we use the last 12 months, as it simplifies the process to determine and enter the other values.
  • Advertising Investment $  – what they spend with us per year. NB: We could get this from our database. we will do this in phase 2 of the tool.
  • Average Customer Spend $ – what an average customer spends per year. This should be provided by the client

We then use traffic data (profile clicks) as a base to determine lead to customer conversion.
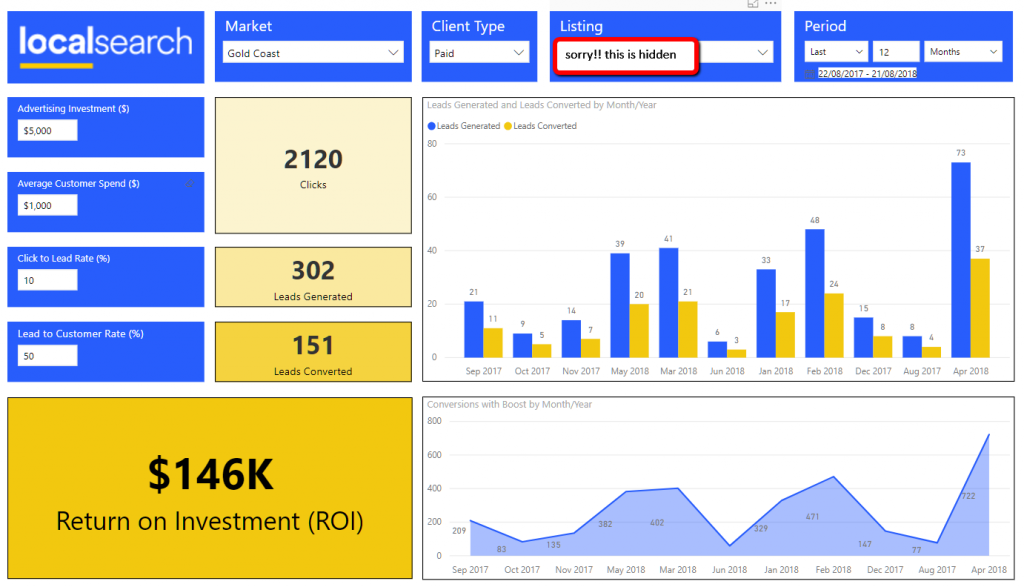
There are then inputs for conversion from leads to customers, which the customer should also provide based on their experience.

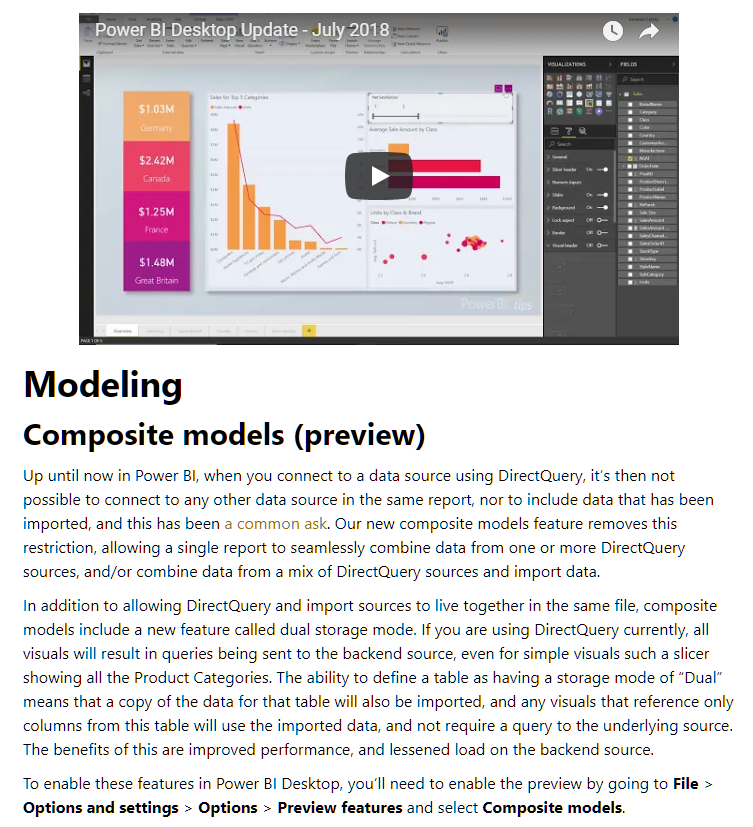
There are some restrictions on how you can use the “what-if” feature and I will run through adding a what-if parameter to highlight this. This feature was made active in the August 2018 release and is briefly described here

To create a new What If parameter, select “new Parameter – What If” from the modelling menu in Power BI.
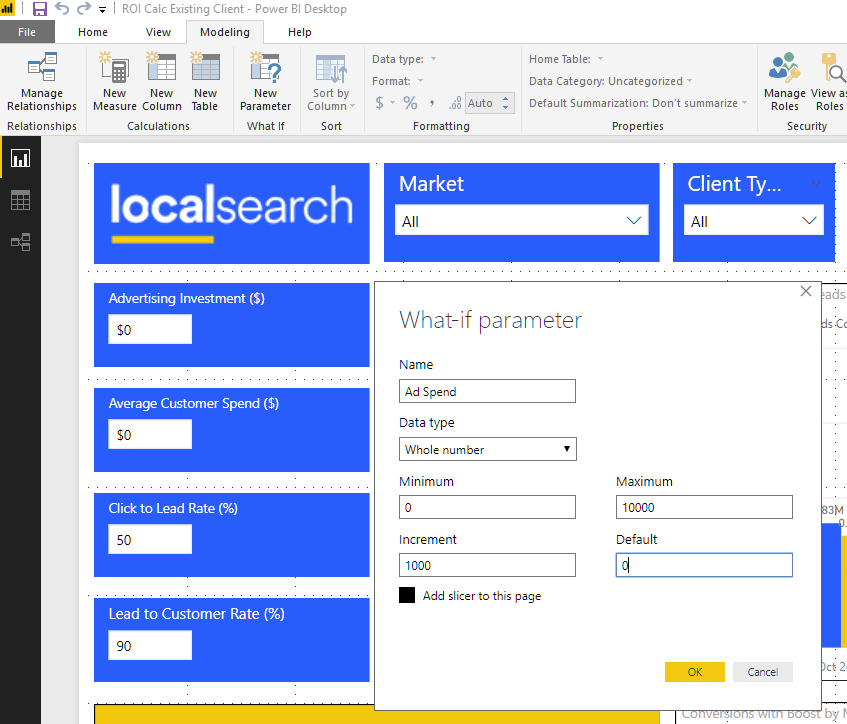
You need to give your parameter the following:

  • Name: This is what it is called in the Model. you can change the label if you use as a filter
  • Data Type: whole, decimal or fixed decimal. I used decimals for the percentages in click to client conversion rates.
  • Minimum: starting value for range
  • Maximum: ending value for range
  • Increment: value the range increment by
  • Default: what value should be used on load

This then creates a table in your model with the incremental values and the default value as a measure. this is what mine look like.

  • Advertising Investment = GENERATESERIES(0, 10000, 100)
  • Campaign Investment Value = SELECTEDVALUE(‘Advertising Investment'[Campaign Investment], 0)

As you can see from the Advertising Investment we now have a series that goes from 100 to 10000. This is where I highlight the limitation of using what if – you can only use a maximum of 1000 values.

This presents an issue for us particularly in entering average customer spend, as due to the varient of our clients it could range from $10 (cafe) to $50,000 (pool builder). This has been noted as a short coming and you can vote for Microsoft to fix it by going here

Ignoring this, the what if parameter has provided a very useful way of providing numeric input in your Power BI reports. Another big thumbs up to the Power BI team.


AdWords + Power BI Part 5 – What does this all tell us?

If you have followed my previous posts I collected data from 3 separate sources.

  • Adwords via Google Big Query
  • SERPS via our Data Warehouse & Google Big Query
  • Revenue data also from our Data Warehouse via FileMaker & SalesForce

Now What? Generally this is where you are directed by a stakeholder to provide a question, that your data helps you answer.

The following is an excerpt from the brilliant article by  – “use Power Bi to supercharge your SEO“. 

“Why would that depth of data be useful? Well, it means we can assess the difficulty to perform in the traffic-driving positions (positions 1–3) and contrast it with the expected return (revenue per click behavior from AdWords behavior for the term historically).

That allows us to laser-focus on terms which provably drive revenue for a business and quantify clearly the impact of performance improvement in revenues gained and paid spend that can be tested for reallocation once a top position is achieved and SERP CTR behavior is higher than expected for the position (indicating searchers are overwhelmingly satisfied with the organic SERP call to action).

Of course, we can flip that analysis approach into reverse and use organic data to lead PPC insights. For example, we can show the revenue available for generic search term expansion where paid behavior is better than expected — indicating a tight match between searcher intent and client product offer — and organic behavior is less than expected (suggesting some level of paid cannibalization). “

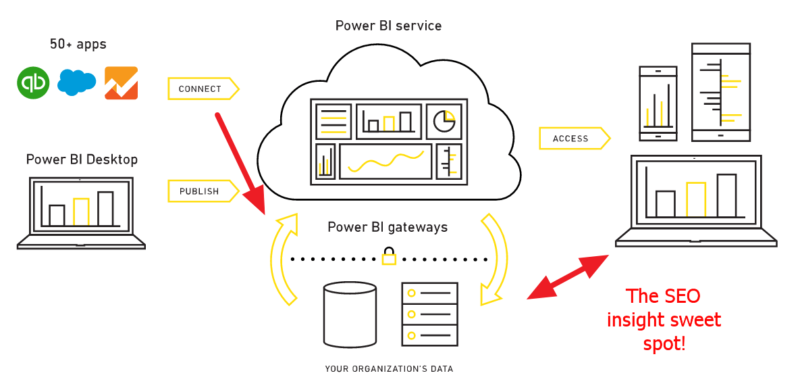
Microsoft Power BI for SEO

For us we had a few questions…

  1. How can we determine where it is worth creating Adwords Campaigns based on revenue and rank.
  2. How can we best allocate campaign spend taking into consideration competition (AdWords & SERPS rank) and expect return on investment
  3. Where are there “low hanging fruit” opportunities, where small amounts of Ad spend can make big impact.

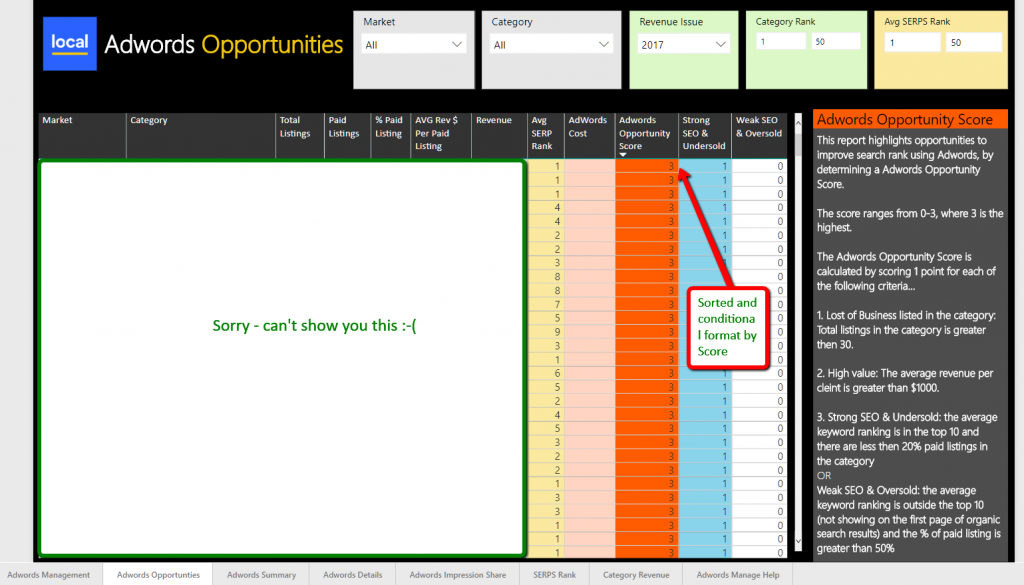
Our approach was to score some key measures against defined thresholds and we defined this as our AdWords Opportunity Score as described  below…

The score ranges from 0-3, where 3 is the highest.

The Adwords Opportunity Score is calculated by scoring
1 point for each of the following criteria…

1. Lost of Business listed in the category:
Total listings in the category is greater then 30.

2. High value: The average revenue per cleint is
greater than $1000.

3. Strong SEO & Undersold: the average keyword
ranking is in the top 10 and there are less
then 20% paid listings in the category

OR

Weak SEO & Oversold: the average keyword ranking is
outside the top 10 (not showing on the first page of
organic search results) and the % of paid listing is
greater than 50%

Below shows the report I created with data hidden…

Adwords + Power BI Part 4 – Combine the data (AdWords, Revenue & Search Ranking) and handling Exceptions

This is a continuation from part 3 about Adwords Reporting in Power BI

So I have demonstrated how to consume Adwords data via Google Big Query in Power BI and replicate existing Adwords Datalabs reports.

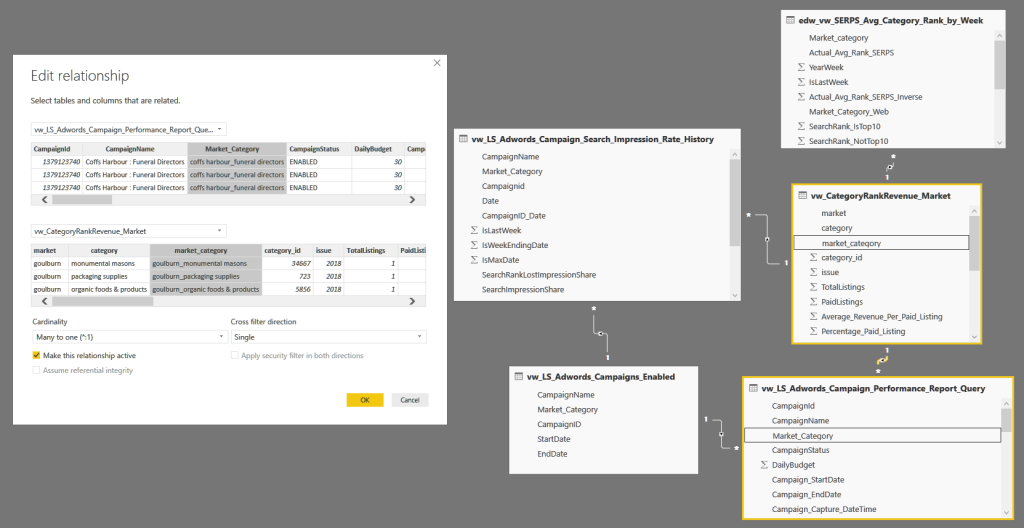
Now we want to mash our data with other data and need to find something common to join on for modelling in Power BI. In our case we are combining Advertising Revenue (Filemaker) and Search Performance data (SERPS) history data from our Microsoft SQL data warehouse.

The common thread for us was Region (Market) combined with the Category. The Market is usually a group of suburbs traditionally used to produce our phone books. The Category is traditionally a grouping of service offerings in our phone books, but in the digital media and search realms, has come to mean a grouping of keywords. So combining Market & Category, we now have a way to join these data sources (for example  Gold Coast_Plumbers).

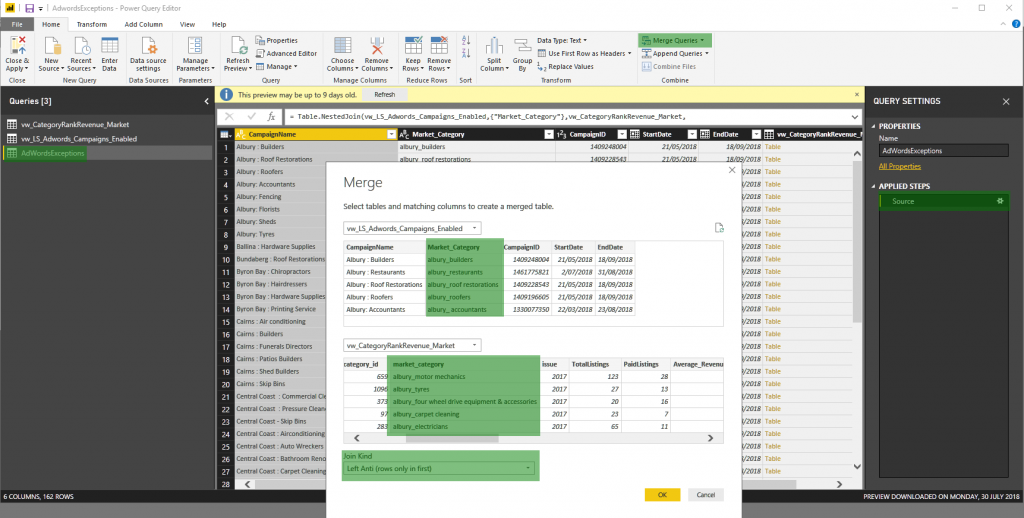
Now we have this to join on, we needed to ensure our Adwords Campaigns were named correctly, and started by producing a “Exceptions Report” in Power BI to highlight those that were not matching. This gave me an excellent opportunity to test the merge feature in Power BI and also the new functionality released in July 2018 to mix data from DirectQuery & Import Sources. I wanted to just provide a list of those campaigns in AdWords without a match in our Category Revenue data, so I used a “Left Anti (rows only in first)” as shown below.

Merging in Power BI is covered better than I could try and explain in this video with Will Thompson

Now this was all well and good until I went publish this to the Power BI service, and discovered the report would not refresh, because they are from mixed sources – Import (SQL) versus DirectQuery (AdWords). After following up with Microsoft, I discovered composite modelling is something just added in the July 2018 preview as a preview feature and is not yet usable in the service, but is under development. As a developer I am happy to work around these short-coming by running this report manually as I need it until this features is made available.

The speed of change, and constant addition of new features shows Microsoft is listening to it’s users and should be commended for this. It makes the product fun to work with and I feel like I am playing a part in the improvement of the product.

So now we have an exception report to try and make sure the data from our various sources match, and when they do match, we now are able to gain new insights to help measure, manage and inform our AdWords spending. In my next post I will share how I approached this…

AdWords + Power BI Part 5 – What does this all tell us?