Having just finished work on a project to develop a mapping solution in Power BI, I though I would share some of my experiences, in case it is of benefit to others.
In a nutshell, I needed to develop a map that allowed the user (a sales representative) to select an Australian Suburb and a Category. The Categories are words used to group business types like Plumbers, Motor Mechanics, Residential Builders etc.
Based on these 2 inputs, the map would then show 2 lists of suburbs based on particular rules that applied to the category and the distance from the chosen suburb. These 2 groupings of suburbs we named as “Geo-Fences” with the rules and radii stored in our database. The reflected area that were considered “free” versus those that were “paid”. Where a business type travels to service it’s client the “paid” geo-fence is larger than “free” and where customers travel to a business the “free” is larger than the “paid”.

“You better cut the pizza into 4 pieces, because I’m not hungry enough to eat 6” – Yogi Berra
We decided to break our deliverable into 3 phases in order to split and tackle the “unknowns” as we went.
- Phase 1 – Show the 2 lists of suburbs (free, paid)
- Phase 2 – Show a map with coloured pins that also indicate the suburbs (free, paid)
- Phase 3 – Show a map with coloured shape for the suburbs (free, paid)
I’ll go into each now in more detail as the speed-bumps and solutions are worth highlighting I think.
Phase 1 – Show the 2 lists of suburbs (free, paid)
Without going to too much detail about how our data is stored here is difficult, but the basic premise is that we have tables for Suburbs and Categories. The suburbs have latitude and longitude which indicated a central point like a post office to pin-point and uniquely identify them. We then had a set of rules stored in the database, which we use to determined a “Geo-Fence Radius” for a suburb and category.
SQL Spatial – A New Frontier
Well new for me at least…
Now we have a Geo-Fence Radius based on a chosen suburb (centoid or center dot) and Category (localisation rule type), we then needed to determine which suburbs were “in” and which were “out”. This is where the SQL Spatial functions made available from SQL Server 2014 on-wards, are particularly useful. With a little googling were were able to write a User Defined Table Function (UDF) that would return the list of suburbs with the derived radius based on the chosen suburb & category. Below shows a code excerpt that might be useful to see how we derived and compare distances using SQL Spatial functions like Geography…
USE [staging_filemaker] GO /****** Object: UserDefinedFunction [dbo].[ufnGetGeoFenceSuburbs] Script Date: 28/03/2018 9:39:53 AM ******/ SET ANSI_NULLS ON GO SET QUOTED_IDENTIFIER ON GO ALTER FUNCTION [dbo].[ufnGetGeoFenceSuburbs](@SuburbID int, @GeoFence_Type INT, @LocalizationRuleTypeID INT) RETURNS @retSuburbInformation TABLE ( -- Columns returned by the function Suburb_ID int PRIMARY KEY NOT NULL, Suburb_Name nvarchar(50) NULL, Suburb_Latitude nvarchar(50) NULL, Suburb_Longitude nvarchar(50) NULL, Suburb_GEOG geography, GeoFence_Type INT NULL ) AS BEGIN DECLARE @Origintext varchar(100), @Origin GEOGRAPHY, @GeoFence_Distance as INTEGER; ---- center point SET @GeoFence_Distance = CASE WHEN @GeoFence_Type = 1 THEN (SELECT (CAST(client_listing_geo_fence_radius as INT)* 1000) --Multiple by 1000 for Kilometers from Suburb_Localisation_Rule_Type as SLRT where SLRT.suburb_id = @SuburbID and SLRT.localisation_rule_type_id = @LocalizationRuleTypeID) ELSE (SELECT (CAST(free_listing_geo_fence_radius as INT)* 1000) from Suburb_Localisation_Rule_Type as SLRT where SLRT.suburb_id = @SuburbID and SLRT.localisation_rule_type_id = @LocalizationRuleTypeID) END SET @Origintext = (Select 'POINT(' + Longitude + ' ' + Latitude + ')' from Suburb as SBRB where SBRB.[Suburb ID] = @SuburbID) -- Set Suburb SET @Origin = GEOGRAPHY::STGeomFromText(@Origintext, 4326); --The code 4326 represents Kilometers --SELECT @Origin, @Client_GEOG_Distance ;WITH CTE_Suburb_Geography as (Select [Suburb ID], [Suburb Name], GEOGRAPHY::STGeomFromText('POINT(' + Longitude + ' ' + Latitude + ')', 4326) as GEOG, Latitude, Longitude -- from Subrub as SBRB) --WHERE [Suburb ID] = @SuburbID) --SET @SuburbID = SELECT [Suburb ID] FROM CTE_Suburb_Geography --IF @SuburbID IS NOT NULL --BEGIN INSERT @retSuburbInformation SELECT [Suburb ID] as Suburb_ID, [Suburb Name] as Suburb_Name, Latitude as Suburb_Latitude, Longitude as Suburb_Longitude, GEOG as Subrub_GEOG, CASE WHEN @GeoFence_Type = 1 THEN 1 ELSE 0 END as GeoFence_Type FROM CTE_Suburb_Geography WHERE @Origin.STDistance(GEOG) <= @GeoFence_Distance; -- This determines whcih suburbs are within the defined distance -- END; RETURN; END; GOThis has been some discussion in Power Bi forums as to why these functions are not yet included in Power BI. You can add your vote here – Support SQL Server Geometry/Geography data types in Power BI
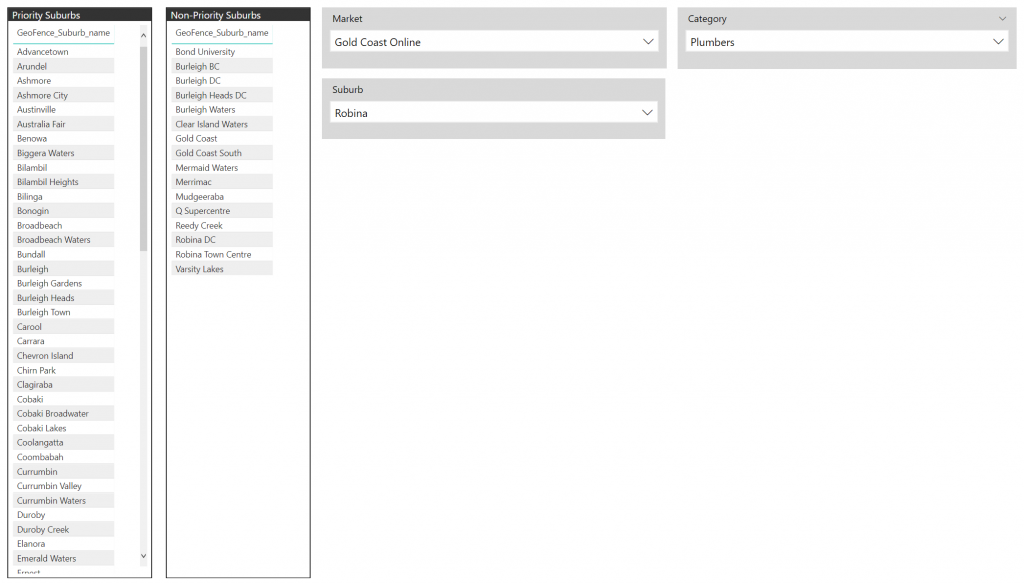
The end result is that we are able to the model the Geo-Fencing for suburbs and present it in Power BI as 2 dynamic list as shown below.

Phase 2 – Show a map with coloured pins that also indicate the suburbs (free, paid) will be covered in the next post…
