AdWords is a Google product, so most AdWords users have probably come across the PowerBI equivalent – Google Data Studio (beta) (well kind of doesn’t compete yet, but will discuss in another post!)…
In Google Data Studio, there are report templates, that can just be pointed to your data, for common Google products like Adwords (now Google Ads). Below is the Google Ads Overview Report Template, which is what our Campaign Strategist was using to manage our AdWords Campaigns. Inside the Google Ads API it is referred to as the “Campaign Performance Report”
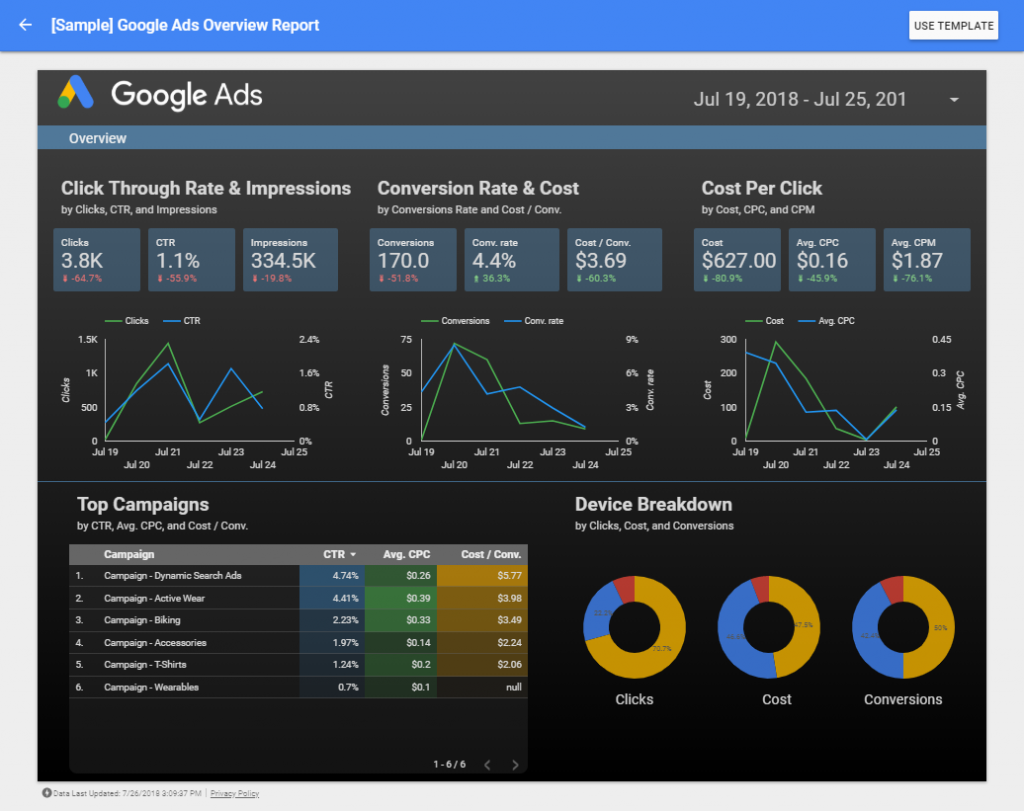
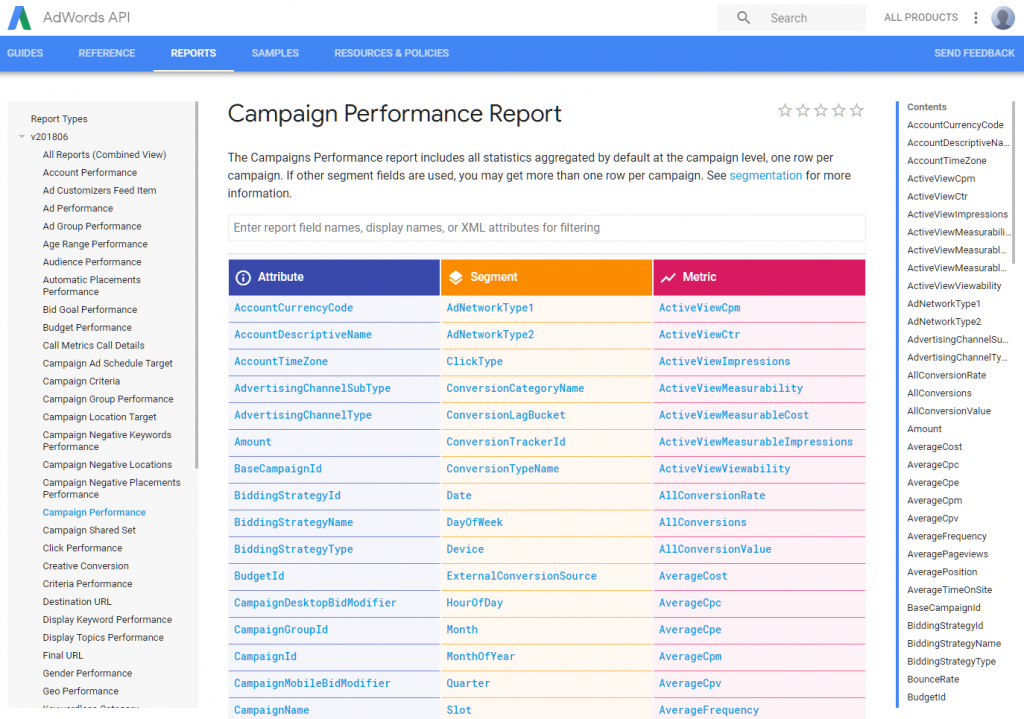
So in order to make sure our Campaign Strategist trusted our data and reporting when we moved it to Power BI, I set about rebuilding this report in Power BI. To do this I needed to create a simplified view using the AdWords data-set in Google Big Query (GBQ) which I could consume in Power BI. And to do that, I needed to understand the Google AdWords (now Google Ads) tables, measures and data model, so I started here
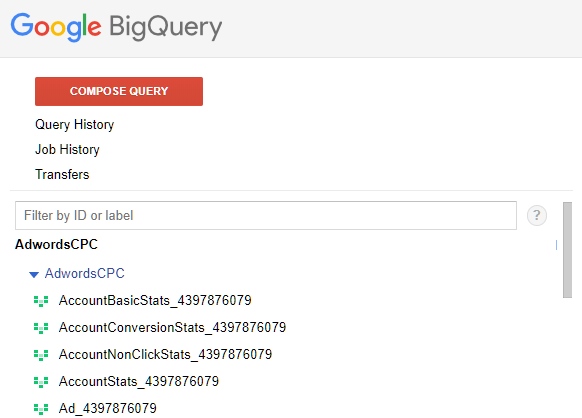
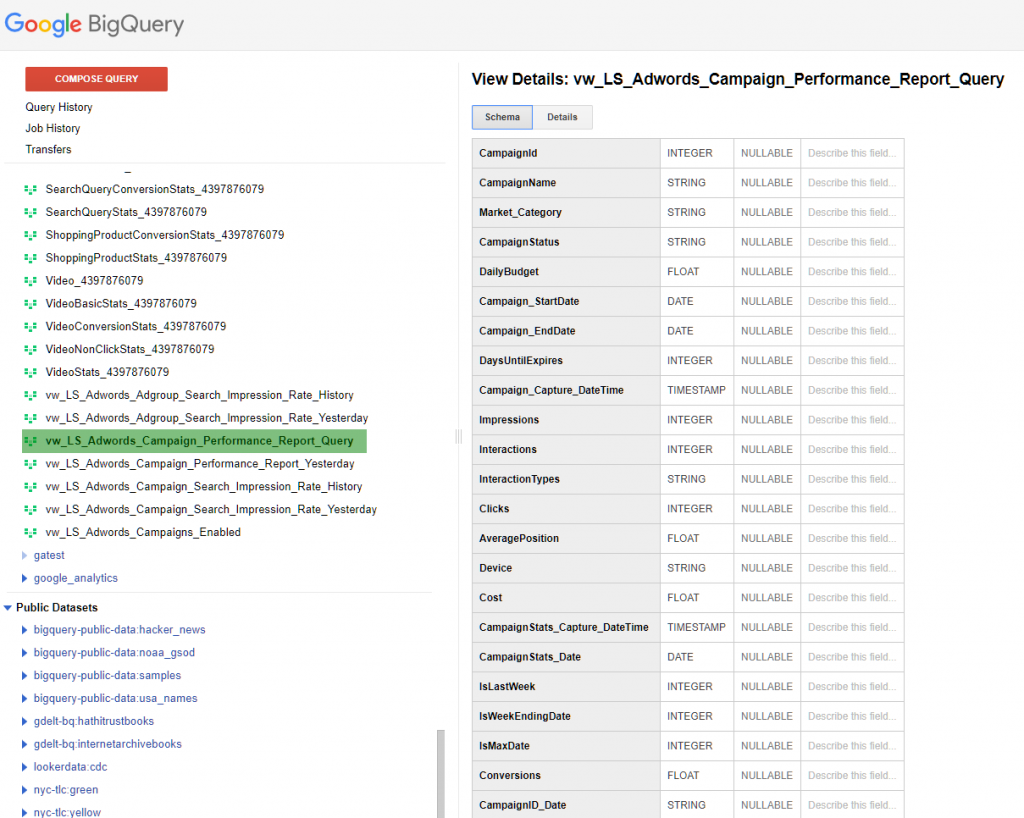
After lots of querying inside the Google Big Query editor interface, I was able to collate most of the data presented in the Google Campaign Report Template together.
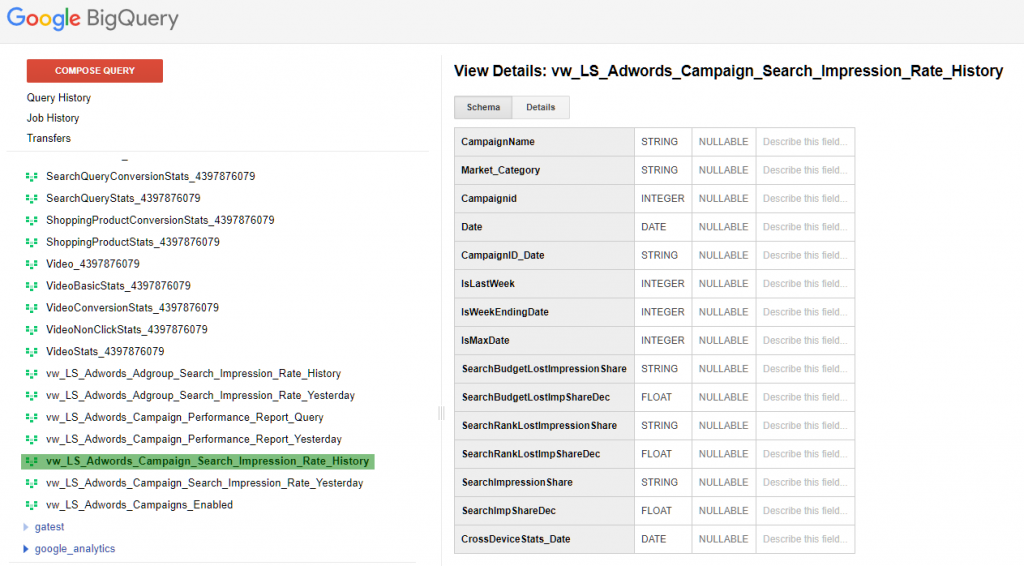
The Search Impression Share was stored in a separate set of underlying tables, so I compiled it into a view of its own to combine via a model once in Power BI.
Now I have the Adwords data I need, in the format I need, to consume it in Power BI and rebuild this report there.
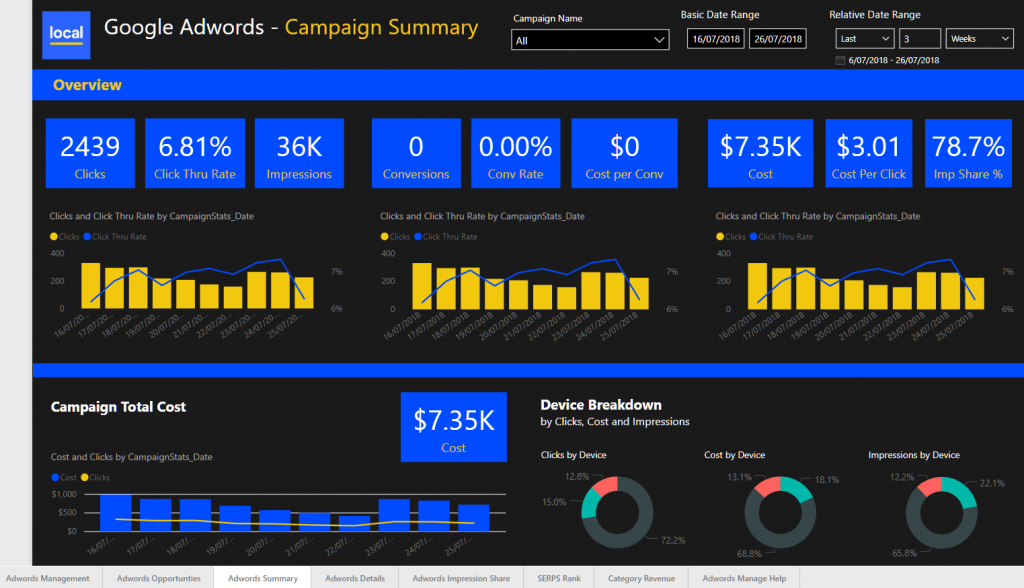
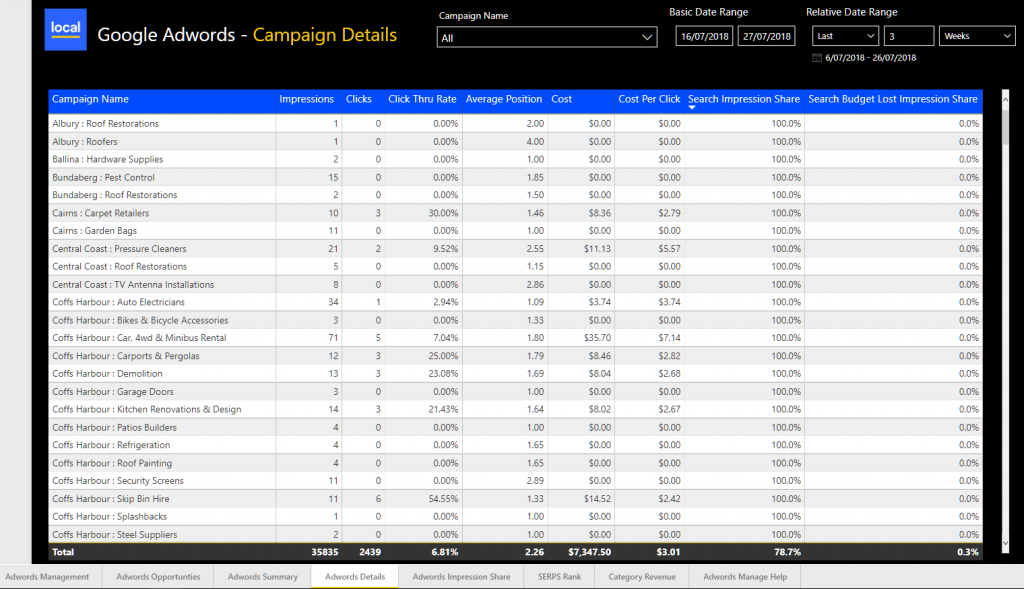
I can also customize the look and filtering and show and drill to details as needed.
I can also now combine it with my other data sources for Revenue and Search Rank. But how can we combine these? This is covered in my next post… Adwords + Power BI Part 4 – Combine the data (AdWords, Revenue & Search Ranking) and handling Exceptions

